System Usage
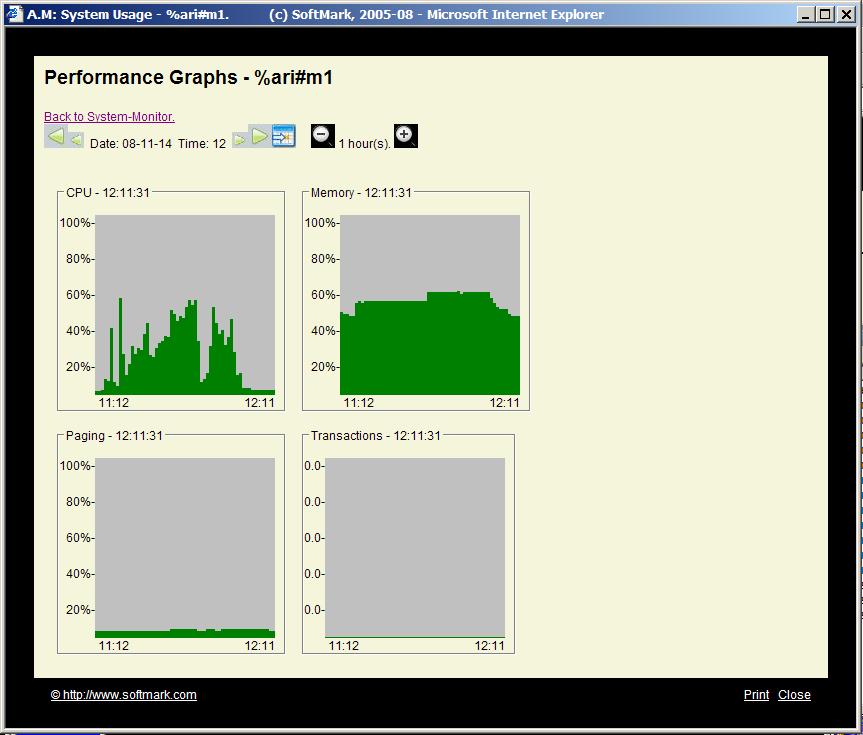
Performance History
Disk Usage
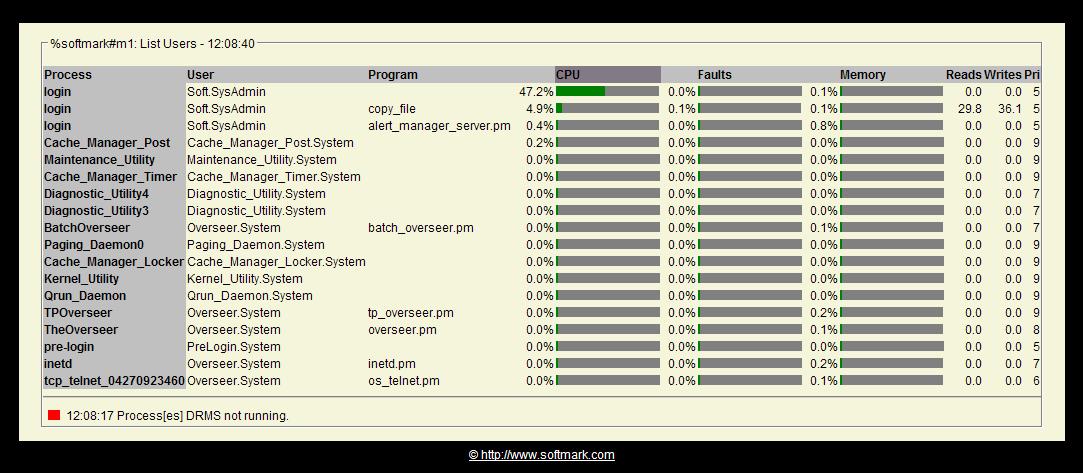
List Users
Queue Monitor-1
Queue Monitor-2
The reporting facility allows the user to examine historical data in On-line Playback Mode and to download report files into spreadsheet applications. SPS also features a system wide Analyze System Server process that reduces the overhead associated with the analyze_system subsystem and allows users to extract periodically and log any set of benchmark values.
SPS produces alert signals and automatically executes corrective commands when any of the monitored meters exceed the allowed thresholds.
|
System Usage |
Performance History |
Disk Usage |
List Users |
Queue Monitor-1 |
Queue Monitor-2 |
 How tall is your application? |
| Determine the performance characteristics of my application | |
| Determine the maximum user load capacity | |
| Demonstrate application and system scalability | |
| Demonstrate the application meets the performance requirements | |
| Determine application and system break point | |
| Determine if the current infrastructure can support the application | |
| Ensure that the infrastructure configuration meets requirements | |
| Ensure that the system operate at with tolerable response times at peak hours | |
| Ensure that the system can sustain predefined throughput | |
| Ensure that the system is optimally configured for performance | |
| Evaluate impact of application on current infrastructure | |
| Understand system behavior with different transaction mix | |
| Pinpoint and remove application and system bottlenecks | |
| Know you limits and prepare for future capacities |
| Records system utilization meters: CPU utilization, page faulting time and rate, disk I/O and system interrupt rates | |
| Monitors transaction rate and identifies processing bottlenecks | |
| Analyzes historical data (hourly, daily, weekly and monthly) and creates spreadsheet-ready, ASCII report files that can be imported into any customer chosen spreadsheet application such as EXCEL | |
| Monitors application queuing activity, messages processed, messages pending, queuing rate and queue depth | |
| Features a real-time, graphical view of all monitored modules | |
| Provides process listings (list_users) sorted by: CPU utilization, I/O rate, Page faults and Interrupt rates | |
| Supports multi-module, multi-system sites | |
| Provides a Playback Mode for historical data analysis | |
| Provides monitoring and alerting functions using any user-defined meters from within analyze_system | |
| Allows threshold and alert settings for all monitored meters |