Access to certain Classes may restricted on a per-user basis. To restrict access to a class code, create a [class-code].ftr file in the alert_manager directory and set standard access rights (give/remove_access) to determine who has access to this Class.
ĀĀĀĀĀĀgive_access null Scheduler_tab.ftr -user John_Smith.*
| System Meters | |||
| Monitored Object | Warning Level | Critical Level | Alert Message(s) |
| CPU | 40% | 80% |
CPU level at XX% Core level at XX%. |
| Empty-Idle | 30% | 10% | Empty Idle level at XX%. |
| Memory Used | 60% | 80% | Low on memory. Used: XX%. |
| Paging Used | 60% | 80% | Low on paging area. Used: XX%. |
| I/O rate | Not Set | Not Set | I/O rate at XX per second. |
| Page Faults | Not Set | Not Set | Page Faults at XX%. |
| Interrupts | Not Set | Not Set | Interrupts at XX%. |
| All SYSTEM meters are within normal range | Performance meters are back to normal levels. | ||
| Ā | |||
| Other Meters | |||
| Monitored Object | Warning Level | Critical Level | Alert Message(s) |
| Disk Space Used | 80% | 90% | Disk [disk-name] is at XX% used. |
| Disk Read Busy | 40% | 60% | Disk [disk-name] is read-busy at XX%. |
| Disk Write Busy | 40% | 60% | Disk [disk-name] is write-busy at XX%. |
| Disk I/O Rate | Not Set | Not Set | Disk [disk-name] is busy at XX I/O per second. |
| All DISK meters are within normal range | Free space on [disk-name] and I/O rate back to normal levels. | ||
| VOS Queues | 100 msgs. | 200 msgs. |
Pending message count on [queue-name]is XXX. Pending message count on [queue-name] is back to normal levels. |
| Process(es) |
Conditions: running / not-running on schedule Resources: CPU, I/O rate, memory, idle too long. |
Process[es] [process-name] not running. Process[es] [process-name] is running; Not intended to run now. Process[es] [process-name] has been idle in the last XX minute(s). Process[es] [process-name] consuming XX% cpu. Process[es] [process-name] performing XXX I/Os per second. Process[es] [process-name] using XX% of total memory.' Process[es] [process-name] running now. (as planned!). Process[es] [process-name] are not running. (as planned!). |
|
| File Watchdog | Conditions: file arrived / created, file missing |
File arrived/created: [nick-name] File [nick-name] has not arrived/created. |
|
| VOS System Log (syserr) | Conditions: any user-supplied filtering / conditions. | Original syserr_log.(date) message. | |
| VOS Security Log (syserr) | Conditions: any user-supplied filtering / conditions. | Original security_log.(date) message. | |
| Application Logs | Conditions: any user-supplied filtering / conditions. | Original log message. | |
| Ā | |||
| Security Filters | |||
| Filter name | Class Code | Action taken / Notes | |
| Internal filter | LIO | Records all login and logout events; records user name and session length in the daily log and in a separate database. | |
| Internal filter | PRI | Records all privileged commands executed by non-privileged users. | |
| Security_01 | S01 | Detected changes to login_admin; AM automatically restores the default settings. | |
| Security_02 | S02 | Detected changes to logout_admin; AM automatically restores the default settings. | |
| Security_03 | S03 | Detected changes to audit_admin; AM automatically restores the default settings. | |
| Security_04 | S04 | Detected changes to password-security; AM automatically restores the default settings. | |
| Security_05 | S05 | Detected changes to system tuning parameters; AM automatically restores the default settings. | |
| Security_06 | S06 | Detected an unauthorized attempt to modify user's start_up.cm macro. AM automatically logs the user out of the system and optionally bans him from the system. | |
| Security_07 | S07 | Detected an unauthorized attempt to access one of the SPS audit trace files. AM automatically logs the user out of the system and optionally bans him from the system. | |
| Security_08 | S08 | Detected an unauthorized or authorized access to a monitored file , marked for object-audit. | |
| Security_09 | S09 | Detected a failed attempt to log into the system. This includes unauthorized attempts, bad-passwords and users whose account has been terminated trying to get in. | |
| Security_10 | S10 | Detected an access-right violation - user attempting to access a directory or file to which he has no sufficient access. | |
------------------------------ SPS/Alert Manager ----------------------------- |
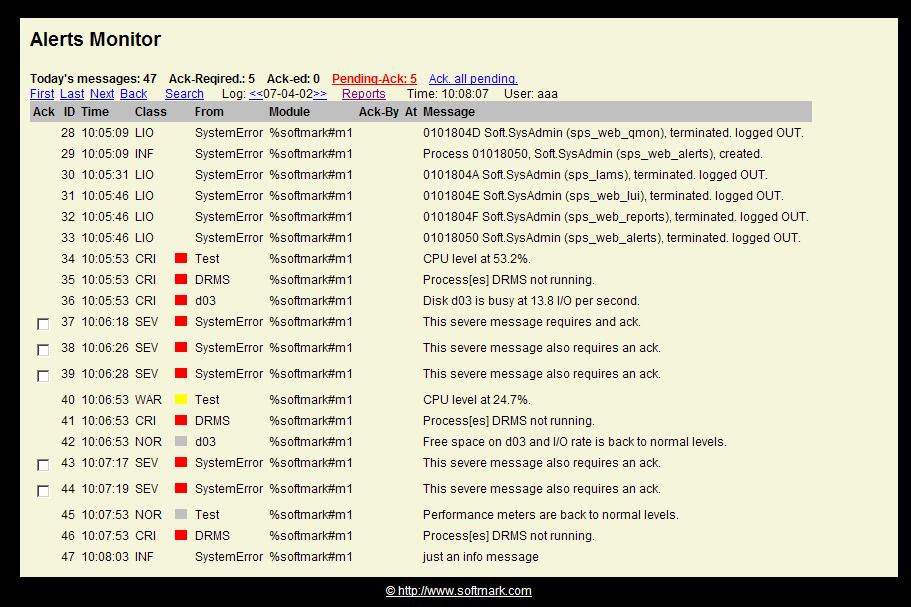
The Monitor has two mode or operations:
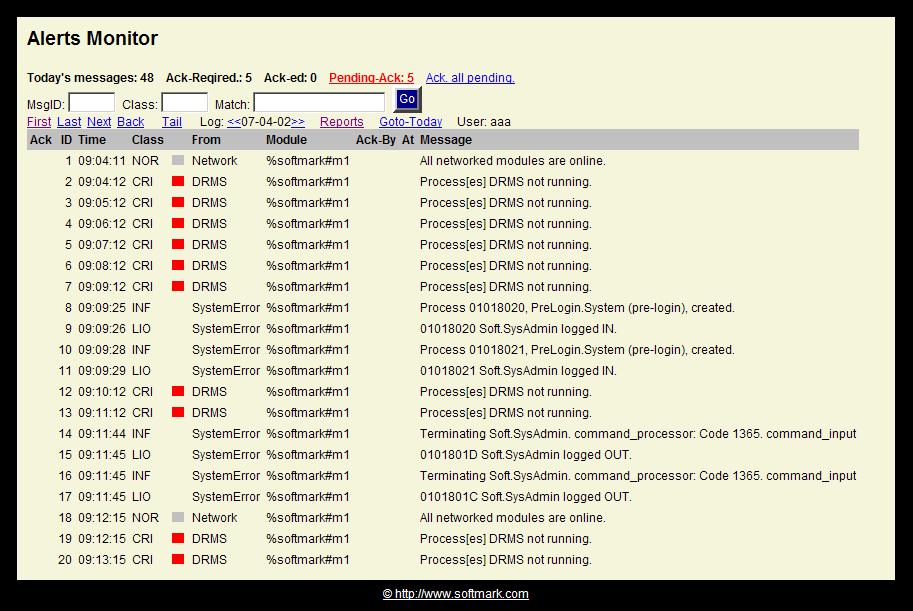
In Search Mode you can:
To switch back to Tail Mode either click the Tail link or simply wait for one minute and the system will switch it automatically to Tail Mode for you.
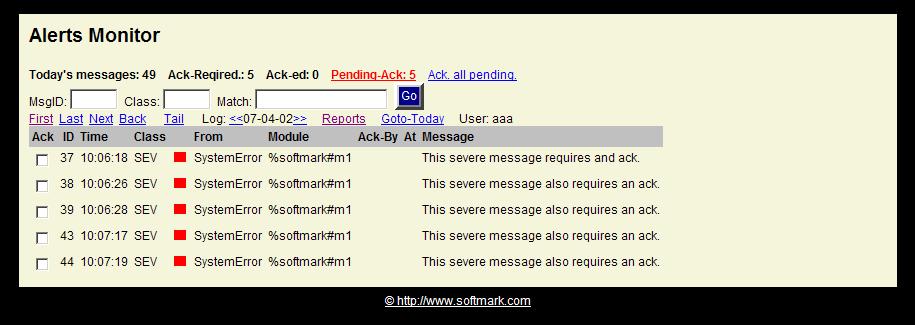
If there are any messages that require acknowledgement and have not yet been acknowledged, the Pending-Ack counter will turn red and will become a clickable link. Clinking it will present a screen with only Ack-Required messages. The operator can then Ack. individual messages or click the Ack-all-pending link to acknowledge all pending messages in the database.
Here is an example for a HTML-formatted report (click to enlarge):
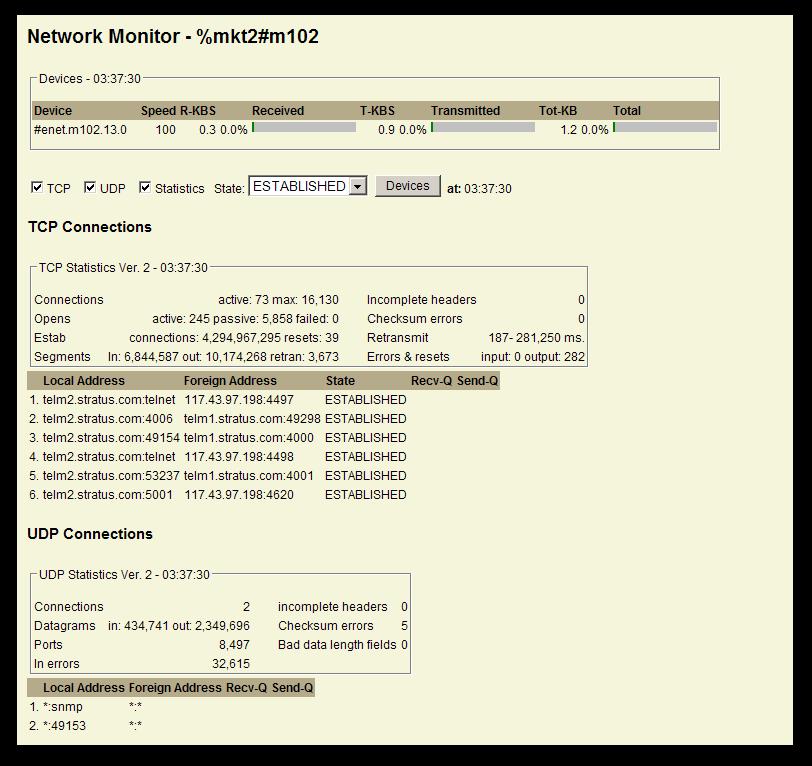
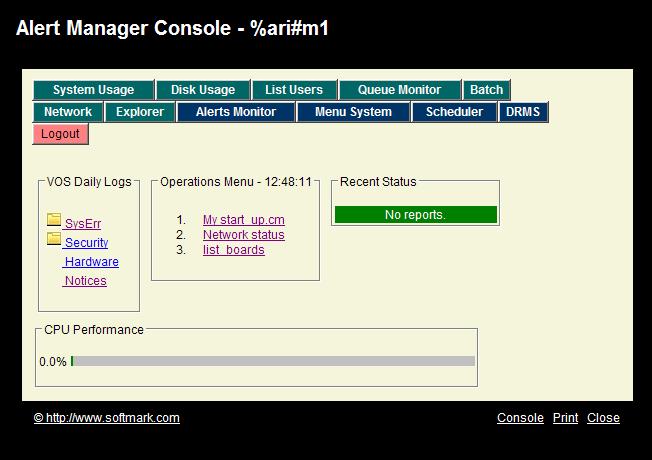
The second area of the Monitor shows graphs and information on:
The third part of the display lists any performance related conditions that have been identified by Alert Manager. If all meters are within their Normal operating range this area will not be displayed.
The second part of the display lists any disk-related conditions that have been identified by Alert Manager. If all meters are within their Normal operating range this area will not be displayed.
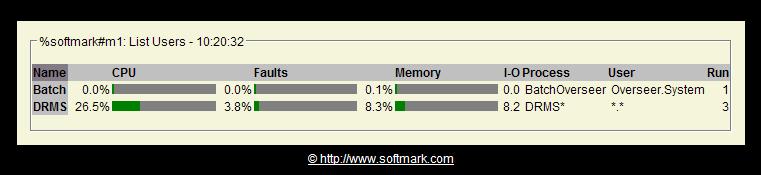
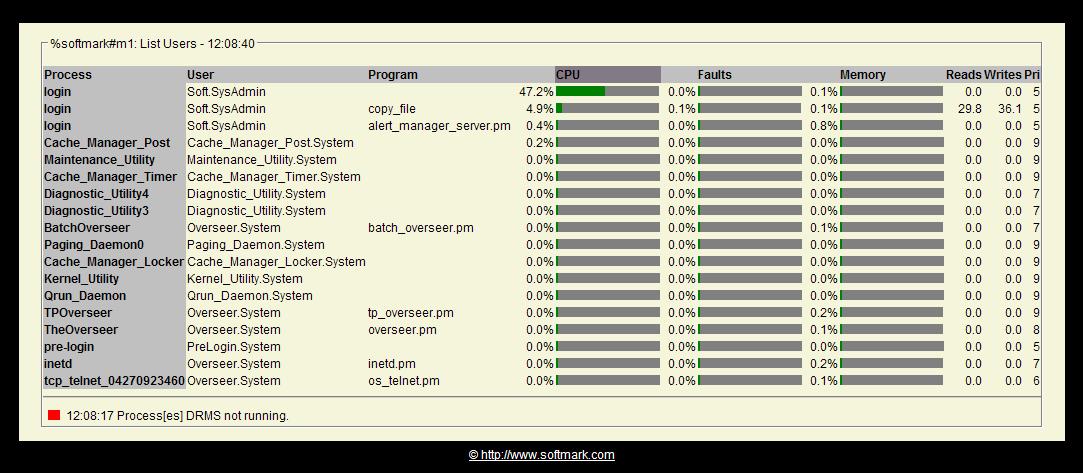
The information may be sorted by CPU, Faults, Memory, I-O Rate, User-name and number of processes. To change the sort order, simply click on any of the table's headings.
In the example below we can see that the 3 DRMS servers are taking 26.5% of the module's CPU and 8.3% of its memory.
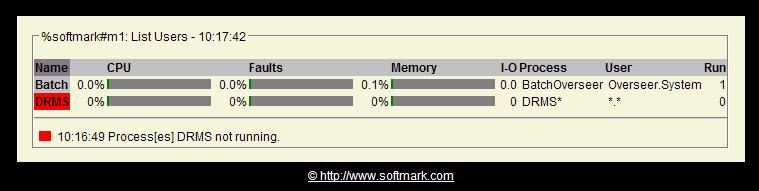
The second part of the display lists any performance related conditions that have been identified by Alert Manager. If all meters are within their Normal operating range this area will not be displayed.
In the example below we can see that the DRMS servers are not running.
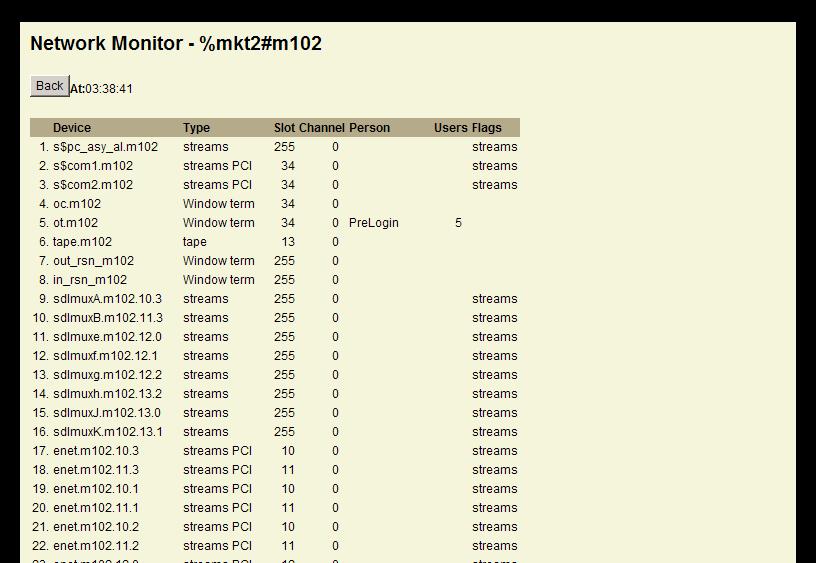
The information may be sorted by Queue-name, ON-queue, Pending count, Highest, Total, TXN (transaction processing rate). To change the sort order, simply click on any of the table's headings.
In the example below we can see that DRMS-X queues are processing at a rate of 70 messages per second and that there are only one or two messages in the queue (pending).
The second part of the display lists any performance related conditions that have been identified by Alert Manager. If all meters are within their Normal operating range this area will not be displayed.
In the example below we can see that the DRMS_App queue went into his Critical state because there are 5973 messages pending processing on it.
In the example below we can see a directory listing all TIN files. You may change the sorting order of the table by clicking any of the table's headings.
| module_nick_name | The name of the module. By default, the VOS module-name will be used. | ||||||||||||||||||||||||||||
| theme | The name of the report_template.html to be used. For example if you specify "blue" then the report_template_blue.html file will be used. | ||||||||||||||||||||||||||||
| other_module_nick_name_xx | The name of the remote module that is expected to report to AlertManager. Either a VOS module name or a nick name can be used. Up to 10 modules can be incorporated to this interface. Also a separate AlertManager server running using a different Environment on the same physical module can act as as "remote-module". | ||||||||||||||||||||||||||||
| other_module_ip_addr_xx | The TCP/IP address and port number of the remote module as follows: nnn.nnn.nnn.nn:NN where NN is the port number. | ||||||||||||||||||||||||||||
| output_device | AlertManager may write messages to a dedicated device like a dedicated printer device. | ||||||||||||||||||||||||||||
| max_allowed_subprocesses | Based on configuration and filtering rules the AlertManager server may start additional sub-processes as configured by the user in the sps_clasess.table. To limit the risk of starting too many sub-processes (filtering rules needs adjustment), you may specify a limit beyond AlertManger will not start any additional sub-processes. | ||||||||||||||||||||||||||||
| max_carry_over |
max_carry_over defines how ack-required messages are copied over to the next day:
|
||||||||||||||||||||||||||||
| network_normal_class | The class/state code that should be assigned when all modules are online. | ||||||||||||||||||||||||||||
| network_critical_class | The class/state code that should be assigned when one or more modules become offline. | ||||||||||||||||||||||||||||
| user_logins_class | If given a valid class code, AlertManager will create entries whenever users log into or out of the system. To disable this feature, remove the class code (blank). | ||||||||||||||||||||||||||||
| priv_command_class | If given a valid class code, AlertManager will create entries whenever users execute a Privileged command. class code (blank). | ||||||||||||||||||||||||||||
| netstat_device_NN | A name of a Streams devices you wish to monitor. | ||||||||||||||||||||||||||||
| netstat_critical | The critical threshold of device utilization as a percentage of the line's capacity. | ||||||||||||||||||||||||||||
| netstat_warnging | The warnging threshold of device utilization as a percentage of the line's capacity. | ||||||||||||||||||||||||||||
| netstat_normal_class | The class code given to a message written to the log once the Streams meters are back to normal levels - below the warning threshold. | ||||||||||||||||||||||||||||
| netstat_critical_class | The class code given to a message written to the log once the Streams meters are higher than the the critical threshold. | ||||||||||||||||||||||||||||
| netstat_warning_class | The class code given to a message written to the log once the Streams meters are higher than the the warning threshold. | ||||||||||||||||||||||||||||
| netstat_options |
A 16-bit encoding that sets the initial options in the Network-monitor window as
follows:
|
||||||||||||||||||||||||||||
| netstat_states |
A 16-bit encoding that sets the initial State options in the NetworK-monitor window as
follows:
|
||||||||||||||||||||||||||||
| send_to_syslog_ip | AlertManager may be configured to send message to a remote Syslog server. Specify the IP address of the target computer. | ||||||||||||||||||||||||||||
| send_to_syslog_port | Specify the port number of the Syslog server (the default is 514). | ||||||||||||||||||||||||||||
| syslog_udp |
If the switch isĀset to 1 (ON), it will open UDP connection to remote syslog. If its set to 0 (OFF), it will open TCP connection. |
||||||||||||||||||||||||||||
| send_to_am_q | The path name of the input-q of the primary AlertManager server. All Status messsage and alerts will be forwared to this queue. | ||||||||||||||||||||||||||||
| disks_interval | An interval, specified in seconds, that defines how often system's disks should be checked (see sps_disks table). | ||||||||||||||||||||||||||||
| performance_interval | An interval, specified in seconds, that defines how often system's performance meters should be checked (see sps_performance table). | ||||||||||||||||||||||||||||
| processes_interval | An interval, specified in seconds, that defines how often running processes should be checked (see sps_processes table). | ||||||||||||||||||||||||||||
| qmon_interval | An interval, specified in seconds, that defines how often application queues should be checked (see sps_qmon table). | ||||||||||||||||||||||||||||
| fwd_interval | An interval, specified in seconds, that defines how often the File-Watchdog layer should be evoked to look for new file arrivals(see sps_fwd table). | ||||||||||||||||||||||||||||
| files_interval | An interval, specified in seconds, that defines how often the application log files should checked (see sps_files table). | ||||||||||||||||||||||||||||
| tcp_interval | An interval, specified in seconds, that defines how often the Streams devicesshould checked. | ||||||||||||||||||||||||||||
| web_session_timeout | An interval, specified in minutes , that defines how the session's inactivity timeout after which the user will be forced to log into the system. | ||||||||||||||||||||||||||||
| web_command_timeout | An interval, specified in seconds, that defines the maximum allowed execution time for a command triggered by a Menu item. | ||||||||||||||||||||||||||||
| scaling_factor | The scaling factor to be used on V-Series modules. For more information see VOS documentation on display_system_usage and how to adjust the scaling factor for hyper-threaded processors. | ||||||||||||||||||||||||||||
| web_xxx_interval | An interval, specified in seconds, between each screen refresh. These intervals apply to all Browser sub-windows monitors - console, alerts, system-usage, disk-info, list-users, queue monitor, batch monitor and network monitor. | ||||||||||||||||||||||||||||
| web_no_lines | The number of lines you wish to set for the Alerts sub-window. | ||||||||||||||||||||||||||||
| web_lui_no_lines | The number of lines you wish to set for the List-Users-All sub-window. | ||||||||||||||||||||||||||||
| web_show_scrollbar | By default, most windows are opened without a scrollbar. Set this switch to enable scrollbars. | ||||||||||||||||||||||||||||
| web_initial_menu | The SPS/Menu can be access via the web interface. If you are licensed to use this package, you may specify any existing menu name as the initial menu. | ||||||||||||||||||||||||||||
| web_require_vos_pass | By default, the initial login screen requires the user to enter a valid user-id and a valid password that is checked against VOS registration file. If this is not required, you can reset this switch to zero and the user can just enter any name that will identify him to the system in which case it will not have to be a real user-id and a password will not be required. | ||||||||||||||||||||||||||||
| web_console_menu_text | You may configure up to 5 commands that the user can execute from the console window. Each command has a text description that appears on the screen and the associated VOS command-line. | ||||||||||||||||||||||||||||
| web_console_menu_command | See explanation on web_console_text. | ||||||||||||||||||||||||||||
| drms_options |
A 16-bit encoding that sets the initial options for the DRMS window as follows:
|
||||||||||||||||||||||||||||
| max_processes | The maximum number of processes running on the system. | ||||||||||||||||||||||||||||
| retain_logs | As part of Alert-Manager's Midnight processing, it will automatically purge old logs depending on the number of days specified in retain_logs. | ||||||||||||||||||||||||||||
| trace |
Use the following values:
|
| class_code |
A unique code that identifies the class. You may make up your own codes or use a
numeric scheme. Suggested codes are:
|
| ignore_on_holidays | When set, Class processing will suspended during holidays. |
| days_mask | Use to suppress the Class during certain days such as weekends. For example,to suppress on Saturday/Sunday, use nyyyyyn. |
| active_from-to | Use hh:mm format These fields are optional. By default Classes are always active. When disabled,there will be no logging and no action taken for the specified Class. |
| dups_interval | A time in minutes. Any duplicate (IDENTICAL) message that arrive within this interval will be ignored. |
| help_text | If given, the text appear on the terminal's status line (25th) when the users tabs to the message. When using a Browser, clicking on the CLASS code link will open a message box with the help_text. |
| wait_for_acknowledgment |
Used to set messages that require the operator's acknowledgement.
|
| acknowledgment_escalation_time | For alerts that require acknowledgement, you can set an escalation procedure where after a certain time (if not acknowledged), AlertManager will produce another alert with a different class code acknowledgment_escalation_class. acknowledgment_escalation_time is specified in minutes. AlertManager executes the escalation feature every 2 minutes so messages may be escalated within up to 2 minutes of their assigned escalation time. |
| acknowledgment_escalation_class | The new Class code that AlertManager will use for the Escalated message. |
| output_q_message | Send to output_q if given in the sps_lam.table control rec. Also used to reply to a Client reading the database. Standard keywords can be used (see below under start_command). |
| email_user_1-10 | Specify up to 10 email nicknames from sps_email_server.tin to receive AlertManager messages. |
| start_job_1-10 | Specify up to 10 jobs / process-names to be started by the Scheduler. For more information, refer to the The SPS/Application Scheduler & Monitor (PCS) User's Guide. |
| scheduler_env | The name of the Scheduler's Environment that governs the started job(s). For more information, refer to the The SPS/Application Scheduler & Monitor (PCS) User's Guide. |
| start_command |
Commands may be started by the Logs Manager. You may include the following keywords
that will be substituted at execution time:
|
| minimum_reporting_interval | A time interval given in minutes within if a message is classified with this Class code, it will not be logged or executed. |
| minimum_execution_interval | A time interval given in minutes within if a message is classified with this Class code, it will be logged but the associated command (=start_command) if any will not be executed. |
|
require_min_occurrences require_min_occurrences_interval |
The require_min occurrences is used to throttle execution of commands (see
=start_command). The interval is specified in minutes.
ĀĀExample: =require_min_occurrences 10 |
| daily_max | The maximum number of messages that can be recorded daily for the class code. |
| send_to_remote_am | If =send_to_remote_am is set, messages will be sent to the Primary AlertManager server via its input queue. |
| color | The unique color you wish to assign the Class. To find out more on choosing colors goto http://www.w3schools.com/html/html_colornames. |
For every type of meter you may define up to 2 thresholds: Warning and Critical.
| logical_name | A unique name that identifies the Object type. For example, use "pre-market-open" for peak hours. |
| active_from-to | Use the HH:MM format to define the time window for this check. This feature allows multiple settings for peak/low periods. |
| cpu_usage |
The percent CPU used by the current module during the last minute. AlertManager will
produce an alert when the system meter exceeds the specified threshold.
Example: CPU level is at [percent CPU]%. |
| empty_idle |
The percent empty-idle used by the current module during the last minute. AlertManager
will produce an alert when the system meter exceeds the specified threshold.
Example: Empty Idle level is at [percent E.I.]%. |
| io_rate |
The critical level of I/O rate performed by the current module during the last minute.
AlertManager will produce an alert when the system meter exceeds the specified
threshold.
Example: I/O rate is at [I/O rate] per second |
| page_fault | The critical level of I/O rate performed by the current module in the last minute. AlertManager will produce an alert when the system meter exceeds the specified threshold. AlertManager will use the "performance_critical_class" class code and post the following message: Page Fault rate is at [PF Rate] per second. |
| interrupts |
The critical level of interrupt rate performed by the current module in the last
minute. AlertManager will produce an alert when the system meter exceeds the specified
threshold.
Example: Interrupt rate is at [Int. Rate] per second. |
| core |
The critical level of percent core used by the current module in the last minute.
AlertManager will produce an alert when the system meter exceeds the specified
threshold.
Example: Core level is at [percent Core]%. |
| used_memory | The critical level of percent-used memory pages. AlertManager will produce an alert when the meter goes beyond this threshold. |
| used_paging | The critical level of percent-used of Paging area. AlertManager will produce an alert when the meter goes beyond this threshold. |
| normal_class | The class/state code that should be assigned to the system performance object when all meters are within the allowed ranges. The code must identify a valid record in the Classes table. |
| warning/critical_class | The class/state code that should be assigned to the system performance object when one of the meters violates its threshold and an alert is produced. The Performance object will remain in the critical state until all meters are back to normal levels. The code must identify a valid record in the Classes table. |
For every type of meter you may define up to three thresholds: Warning, Severe and Critical.
| logical_name |
A unique logical name for the Object. Any name that starts with Any_Process
allow to create an alerts if any of all running processes exceed the
critical_cpu threshold. Multiple Any_Process records can be set for different
time-windows using the active_from/active_to fields - for example:
=logical_name Any_Process_morning |
| process_name | A unique name that identifies the process. The name must be identical to the process name as started by VOS. To get an accurate, up-to-date list of valid process names, execute the "list_users" command and record the process names that appear in parenthesis. You may used star-names. |
| user_name | The name or the starname (e.g. *.Operator) of the user that is executing the processes. To get an accurate, up-to-date list of valid user names, execute the "list_users" command. You may used star-names. |
| active_from-to | Use the HH:MM format to define the time window for this check. This feature allows multiple settings for peak/low periods. |
| no_of_processes | The number of processes you expect to be up and running under the same user-name and process-name. |
| must_be_up_from-to |
Use the hh:mm format to define the time of day the process is expected to be up and
running. Note that if "must_be_up_from" and "must_be_up_to" are not specified, then
AlertManager assumes that the process should be up and running at all times. When the
process violates this condition, AlertManager will post a message with the
"process_up_critical_class" class code along with the message:
Process [logical_name] is not running. |
| must_be_down_from-to |
Use the hh:mm format to define the time of day the process is not expected to execute.
This feature is useful to cover situations where a running process may interfere with
normal production activity. When the process violates this condition, AlertManager will
post a message with the "process_down_critical_class" class code along with the
message:
Process [logical_name] is running; Not intended to run now. |
| critical_cpu |
The Critical CPU consumption threshold represented as the percentage CPU by the
process(es) every interval. AlertManager will bypass with check if you do not supply a
value (zero). To find what is the current consumption of a process:
When the process violates this condition, then AlertManager will post a message with the "process_busy_critical_class" class code along with the message: Process [logical_name] is consuming XX %CPU. |
| critical_io_rate |
The I/O rate threshold represented as the number of disk I/Os performed by the process
every second. AlertManager will bypass with check if you do not supply a value (zero).
To find what is the current consumption of a process:
Start "list_users -interval 10". Record the typical number of Reads(DDKR) and Writes (DDLW) the process performs. The average I/O rate is: DDKR+DDKW / interval-of-list_users (10). When the process violates this condition, then AlertManager will post a message with the "process_busy_critical_class" class code along with the message: Process [logical_name] performing XX I/Os per second. |
| critical_memory | The critical level of memory utilization as a percentage of the memory pages on the system. |
| process_normal_class | The class/state code that should be assigned to the monitored process when the process is in its Normal state. The code must identify a valid record in the Classes table. |
| process_down_critical_class |
The class/state code that should be assigned to the monitored process when the process
is in its Critical state, specifically when it is NOT running as expected. The code
must identify a valid record in the Classes table. When a process is in violation of
this condition, AlertManager produces the following message:
Process [logical name] is not running. |
| process_up_critical_class |
The class/state code that should be assigned to the monitored process when the process
is in its Critical state, specifically when it is running during times when it is
scheduled to be down. The code must identify a valid record in the Classes table. When
a process is in violation of this condition, AlertManager produces the following
message:
Process [logical name] is running; Not intended to run now. |
| process_busy_critical_class | The class/state code that should be assigned to the monitored process when the process is in its Critical state, specifically when it is violating its performance related thresholds. |
| logical_name | A unique logical name for the Object. |
| q_path | The relative or full path-name of the monitored queue. |
| active_from-to | Use the HH:MM format to define the time window for this check. This feature allows multiple settings for peak/low periods. |
| pending_alert | Set the "Pending Message count" threshold. An alert will be produced when the queue's actual pending messages exceeds this limit. |
| normal_class | The class code that AlertManager assigns to monitored queues that are in the normal state. The code must identify a valid record in the Classes table. |
| warning/critical_class |
The class code that AlertManager assigns to monitored queues that are in the critical
state. The code must identify a valid record in the Classes table. When a monitored
queue in violation of its threshold, AlertManager produces the following message:
Pending message count on [logical name] [# of msgs.]. |
| logical_name | A unique logical name for the Object. |
| active_from-to | Use the HH:MM format to define the time window for this check. This feature allows multiple settings for peak/low periods. |
| input_path | The relative or full path-name of the monitored file. |
| must_exist | if =must_exists is setĀand the file is not there, the =critical_class will be executed. Once the file is created the =normal_class will be executed. |
| must_not_exist | if =must_not_exists is setĀand the file is there, the =critical_class will be executed. Once the file is deleted the =normal_class will be executed. |
| must_arrive | Set to "1" if file must appear within the specified time window. If the file does not arrive within the specified window, AlertManager will log and execute the critical_class class-code. |
| allow_lockers | By default, AlertManager will not log or execute the file_arrival_class as long as there is one or more processes locking the file. When the switch is set, AlertManager will execute the file_arrival_class regardless if there are any lockers. |
| normal_class | A class code that AlertManager should set for the object while waiting for the file to arrive. |
| file_arrived_class | A class code that AlertManager should log and execute upon file arrival. Important: It is the responsibility of this class-code to delete or rename the file to prevent unnecessary executions. |
| critical_class | The class/state code that should be assigned to the File Monitor object when the file does not get created within the required time window provided that must_arrive is set. |
| logical_name | A unique logical name for the Object. |
| path | The actual name of the disk (%sys#d01, %sys#d02). Paths can also be any directory or file on the system. In the case of a file, AlertManager will create an alert when the number of block exceed either the warning_percent_used or the critical_percent_used meters using the =file_max_block (start-names are supported). In the case of a directory, AlertManager will create an alert when the number of objects (files,links,dirs) exceed either the warning_percent_used or the critical_percent_used meters using the =dir_max_objects. |
| active_from-to | Use the HH:MM format to define the time window for this check. This feature allows multiple settings for peak/low periods. |
| critical_percent_used |
In the case of a disk - the percent of used space. When the disk pack is in violation
of this condition, AlertManager produces the following message:
Disk [logical name] is at [percent used]% used. In the case of a file - the percent of disk blocks used compared to =file_max_blocks. When the file is in violation of this condition, AlertManager produces the following message: File [logical name] is NNN blocks - NN% of its allowed size. In the case of a directory - the percent of number of objects compared to =dir_max_objects. When the dirctory is in violation of this condition, AlertManager produces the following message: Dir [logical name] has NNN objects - NN% of its allowed limit. |
| critical_io_rate |
The number of I/O rate performed on any given disk on the current module during the
current interval. AlertManager will produce an alert when the system meter exceeds the
allowed threshold. When a disk pack is in violation of this condition, AlertManager
produces the following message:
Disk [logical name] is busy at [# of I/Os] I/Os per second. |
| critical_read_busy | A threshold for the disk's %read-busy meter. |
| critical_write_busy | A threshold for the disk's %write-busy meter. |
| file_max_blocks |
A threshold for file size given in block when monitoring a file. When the file exceeds
the given threshold (actual number of blocks reaches the warning/critical% used
settings), AlertManager produces the following message:
File [logical name] is NNN blocks - NN% of its allowed size. |
| dir_max_objects |
A threshold for maximum number of objects (files,links,dirs) that is expected for a
directory. When the directory exceeds the given threshold (actual number of objects
reaches the warning/critical% used settings), AlertManager produces the following
message:
Dir [logical name] has NNN objects - NN% of its allowed limit. |
| normal_class | The class code that AlertManager assigns to monitored disks that are in the normal state. The code must identify a valid record in the Classes table. |
| warning/critical_class | The class code that AlertManager assigns to monitored disks that are in the critical state. The code must identify a valid record in the Classes table. |
| logical_name | A unique logical name for the Object. |
| input_path | A path of a file or a 1-way-server-q from which AlertManager will read incoming messages. You may use star names (e.g xxx*.out). AlertManager will automatically use and switch to the most recently created file that matches the star-name. If possible, the user should avoid using star-names. Use star-names when a time-stamp is used as part of the file name(s). |
| input_ip_addr | The TCP/IP address if Alert Manager is required to read alerts form another computer. This could be a to another system or a network-ed Stratus running AlertManager. |
| input_ip_port | The TCP/IP port number if Alert Manager is required to read alerts form another computer. This could be a to another system or a network-ed Stratus running AlertManager. |
| start_pos | Specifies the position from which AlertManager should examine the messages. The VOS syserr_log files have a time stamp in the first 8 position followed by two spaces. The user should therefore set the starting position to 11. |
| end_pos | Specifies the last position that AlertManager should use when examining the contents of messages. By default, the server will use the entire message buffer. |
| tcam_log |
When set (on TCAM system only), AlertManager will strip off leading data fields of the
message that are not necessary for display.
Example: 07:09:50 CTPS: (TPServer_1) [task 5] tp$server.pm :%INFO- Session starting. AlertManager will log: TPServer_1(i): Session starting. |
| toggle_status_filters |
The idea behind this switch is to create a logical Object that is either in a
Critical-State or in a Normal-State. This is like all other objects (disks, cpu etc.)
only that now we're dealing with TEXT filters and something that is detected by looking
at a log file. The first filter detects the critical mode; the second filter detects
the normal mode. In the following example ABC will either be in a A_1 or A_0 mode.
/ |
| use_filter_01..16 | The use_filter_XX fields are links to Filter records (see the Filters Table). Filters are used to classify messages. You may use up to 10 filters. |
| filter_name | A unique name that identifies the Filter. |
| class_code | A code that links the Filter to a Class record. This field is required. AlertManager uses it to classify messages and take certain actions. |
| match_and_01..16 | All match_and strings must exist in the message, otherwise AlertManager will ignore the message. |
| match_or_01..16 | At least one of the match_or strings must exist in the message, otherwise AlertManager will ignore the message. |
| omit_and_01..16 | AlertManager will ignore messages if all omit_and keywords appear in the message. |
| omit_or_01..16 | AlertManager will ignore messages if at least one omit_or keywords appear in the message. |
| msg_prefix | The user may specify a message prefix. AlertManager will append this text to the beginning of incoming message. This may be useful for easy message identification. |
| caseless | A switch that defines the case sensitivity. Set to 0 for case sensitive matching (default). |
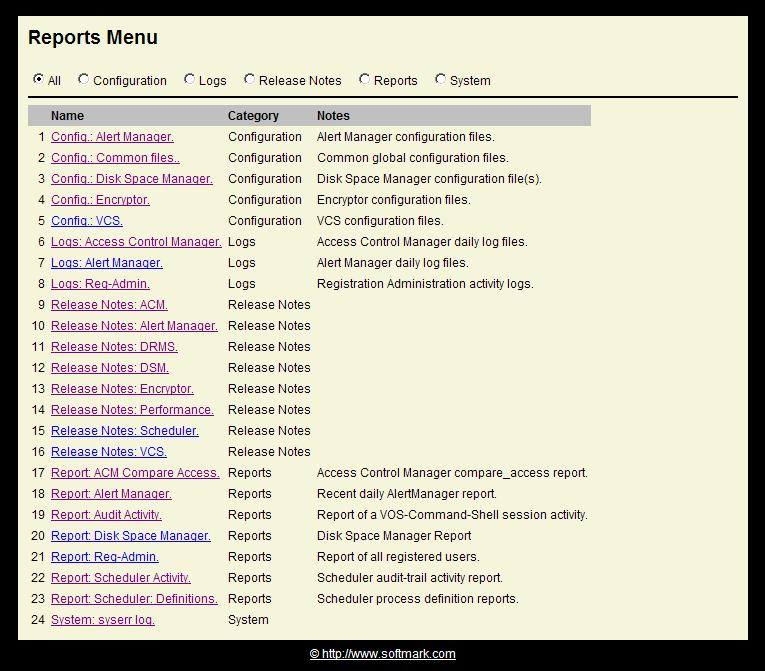
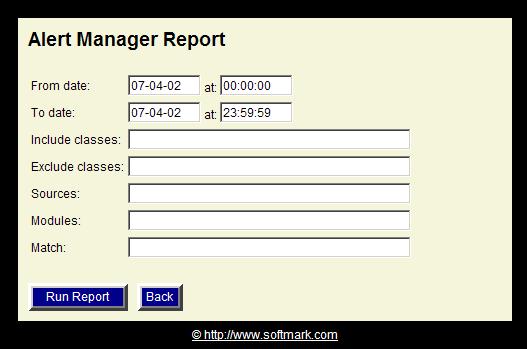
| logical_name | A unique name that identifies the Report. |
| category | User-defined categories, for example: reports, configuration, release_notes etc. |
| report_path | The full path name of the report file or files (star-names are supported but limited to 1024 files). At least one of the match_or strings must exist in the message, otherwise AlertManager will ignore the message. |
| notes | Notes, description, instructions etc. |
| acl_name |
A name of a FTR control file that governs the user's access to the item. This will be
best explained by an example. Consider the following entry:
/ In the SPS>alert_manager directory, create a security_1.ftr file. If the current user has access (read or write) to the security_1.ftr file, the item will be displayed on the list otherwise it will not. This provides an easy way to control privileges based on the user-id. |
| report |
A unique name that identifies the Report. To produce a report execute:
alert_manager_server.pm -command report -name [report-name] |
| from | A standard-VOS data-time that define the time start date/time selection criteria. |
| to | A standard-VOS data-time that define the time end date/time selection criteria. |
| include_class_NN | A list of one or more classes to be included in the report. Star-names may be used. |
| exclude_class_NN | A list of one or more classes to be excluded in the report. Star-names may be used. |
| sources | You can specify any number of Sources from which messages originated. |
| modules | You can specify any number of module names from which messages originated. |
| match | If you choose a match-string, then only messages that contain the string will appear in the report. |
| output_path | The relative or full path name of the report file. |
| You can choose to send the report via you E-Mail Server to selected users. Simply enter their email nick-names as defined in the sps_email_server.table. |
You'll need to define your Email Server in the SPS>alert_manager>sps_email_server.tin and then create the table.
organization:            relative;
index       :            server_name no_duplicates;
fields      :
server_name              char (32) var,
server_ip_address        char (32) var,
server_port_number       bin (15) default ('0'),
user_name                char (32) var,
password                 char (32) var,
use_domain               char (32) var default ('softmark.com'),
nick_name_XX             char (32) var,
e_address_XX             char (256) var,
debug                    bit (1) aligned default ('0'),
trace                    bit (1) aligned default ('0');
end;
| server_name | A logical name for the Email server. The default settings should not be changed. |
| server_ip_address | The server IP address of the Server. You might need to get this from your Network manager. |
| server_port_number | The server IP address of the Server. You might need to get this from your Network manager. |
| user_name | The user_name is only required if the Email server requires authentication. |
| password | The password is only required if the Email server requires authentication. |
| use_domain | The domain name from which the message will arrive. |
| nick_name_xx | Set up to nick-names for persons authorized to receive reports and alerts from the system. |
| e_address_xx | The corresponding email addresses for everying nick-name that was defiened. |
| debug | Set to 1 if you neet to troubleshoot this service. |
| trace | Set to 1 if you neet to troubleshoot this service. |
Example:
/
=server_name                  sps_mail_server
=server_ip_address            outgoing.myserver.net
=user_name                    Bob
=password                     my_pass123
=nick_name_01                 Joe
=e_address_01                 job@mycompany.com
=trace                        0
If your Class definition (sps_classes.tin) includes:
=output_q_message '@time: @msg'
then your messages on UNIX/Linux will look like the following example:
Oct 7 14:40:08 localhost 14:40:58: All networked modules are online.
Installation:
In SPS>alert_manager>alert_manager.tin define the following fields where the =send_to_syslog_ip and =send_to_syslog_port are the IP Address of your UNIX box and a port number of syslog daemon program. If your syslog daemon is using UDP (mostly the case) then set syslog_udp switch to 1. If it is using TCP, then set syslog_udp switch to 0.
=send_to_syslog_ip               XXX.XX.XX.XX
=send_to_syslog_port             514
=syslog_udp                      1
Once you start the Alert Manager Server, you can get all your reports by using the following URL:
http://[XX.XX.XXX.XXX]:[NNNN]/AlertManager
XX The-ip-address-of-your-stratus
NN The port-assigned-in-sps_files
http://68.161.237.188:1024/AlertManager
![]() ĀĀTo improve reposonse time add the following line as the first line of your
start_up.cm:
ĀĀTo improve reposonse time add the following line as the first line of your
start_up.cm:
ĀĀĀĀ&if (index (process_info process_name) 'AlertManager') ^= 0 &then &return
Example: Let's say you wish to create your own QA environment with your own configuration files, alerts etc. To keep it simple, let's just say that you wish to monitor your own queues. All you need to do is: