
|
| VOS Console is the LITE/FREE version of Alert Manager. It is a complete set of practical monitoring tools that provides Browser interface to VOS and eliminates security risks associated with users working in a critical environment. |
| VOS-Console is a secure, read-only interface that allows access only to registered users and inherits all of VOS' security: login-admin and password management. | |
| VOS-Console limits users only to their own customized, view-only VOS Console, will not be able to access the module via Telnet or FTP and will be audited every step of the way. | |
| VOS Console does not requires any commitment, additional software, licenses or even configuration effort -- it will be up and running in a few minutes. |
|
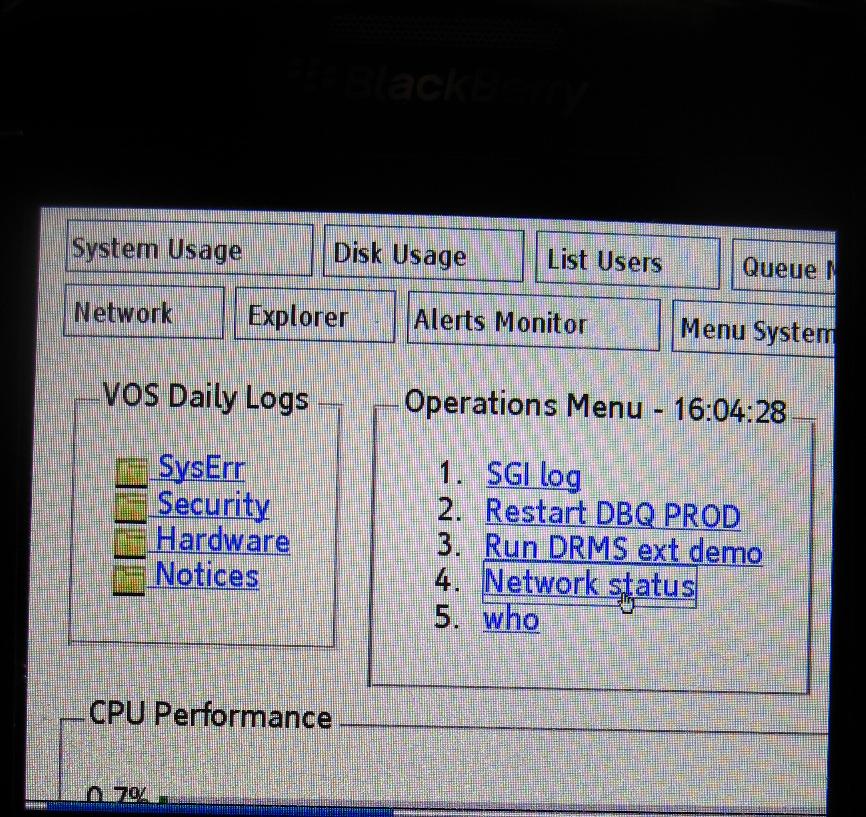
System Usage |
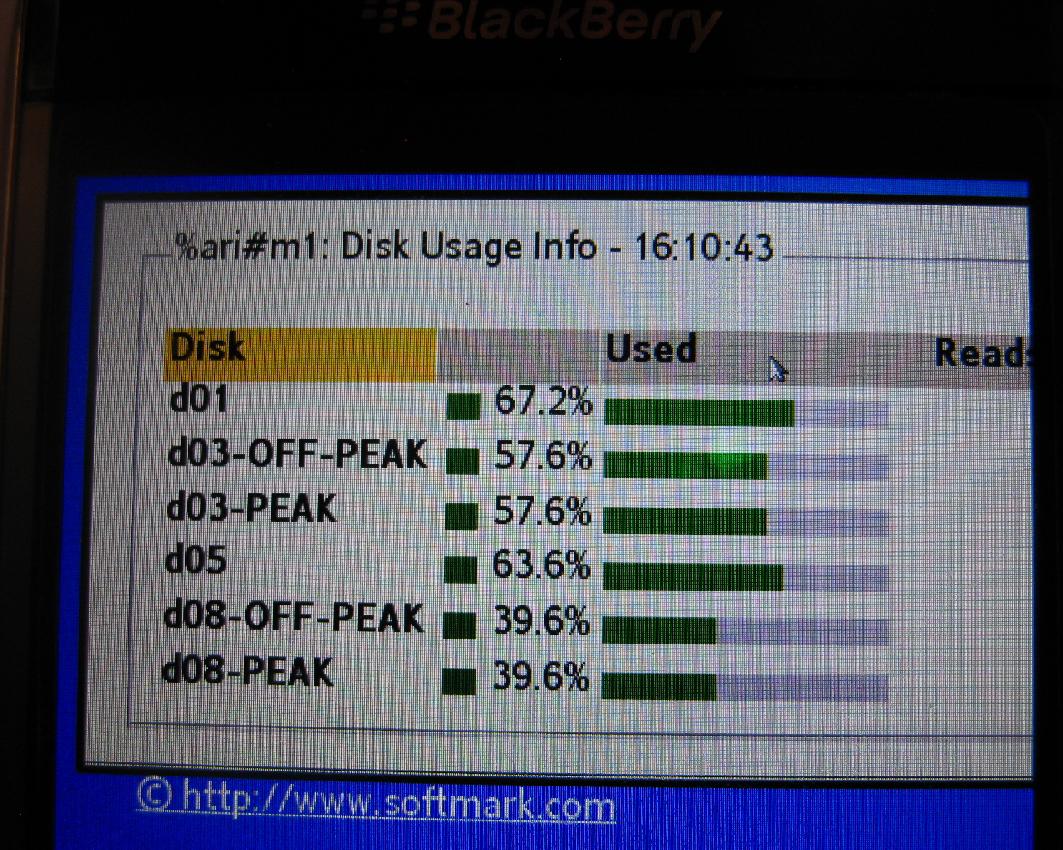
Disk Usage |
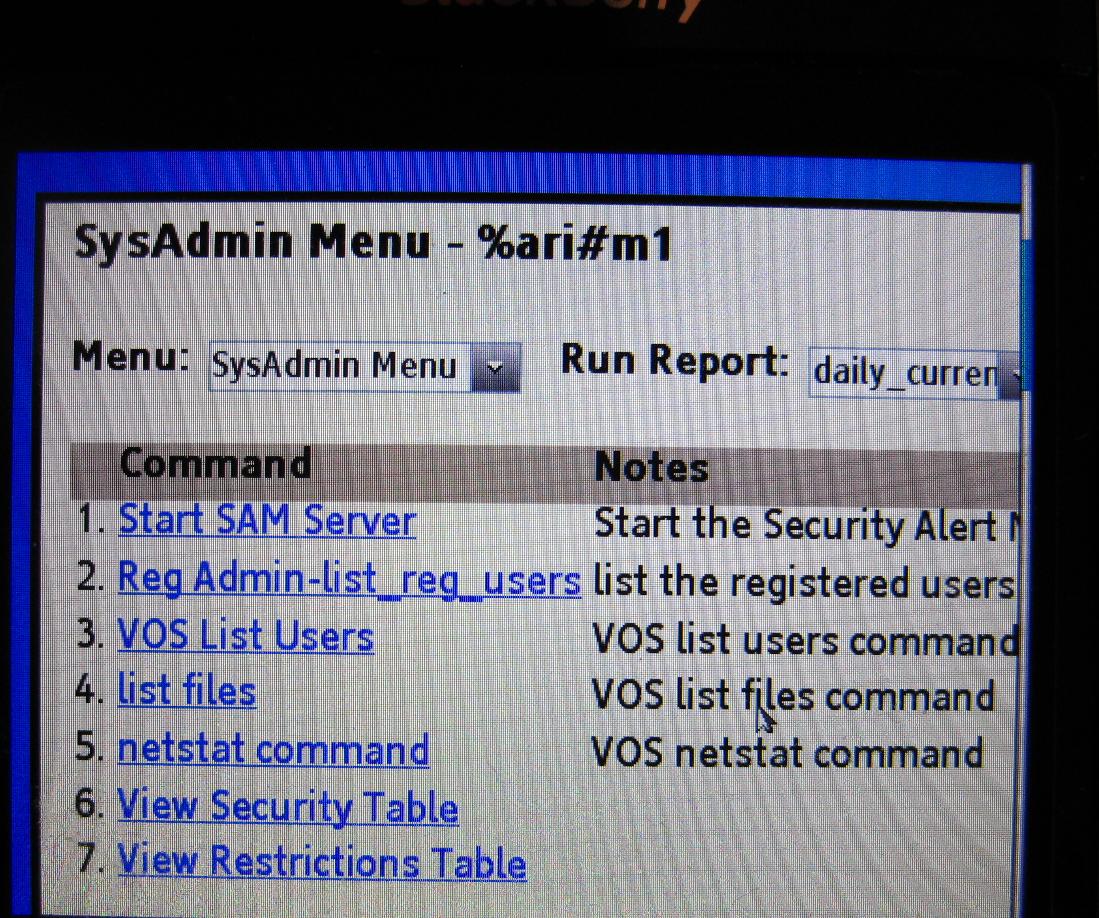
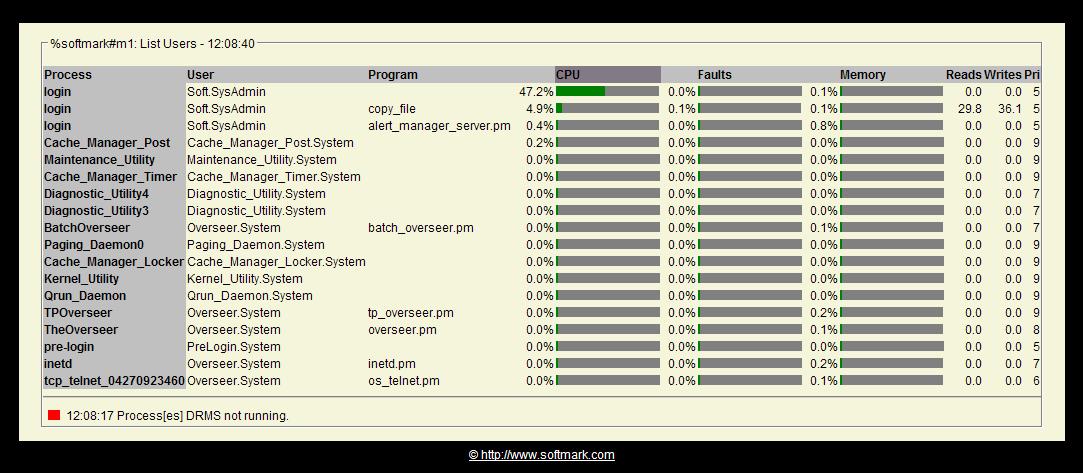 List Users |
Queue Monitor-1 |
Queue Monitor-2 |
 Explorer-1 |
Explorer-2 |
Batch Monitor |
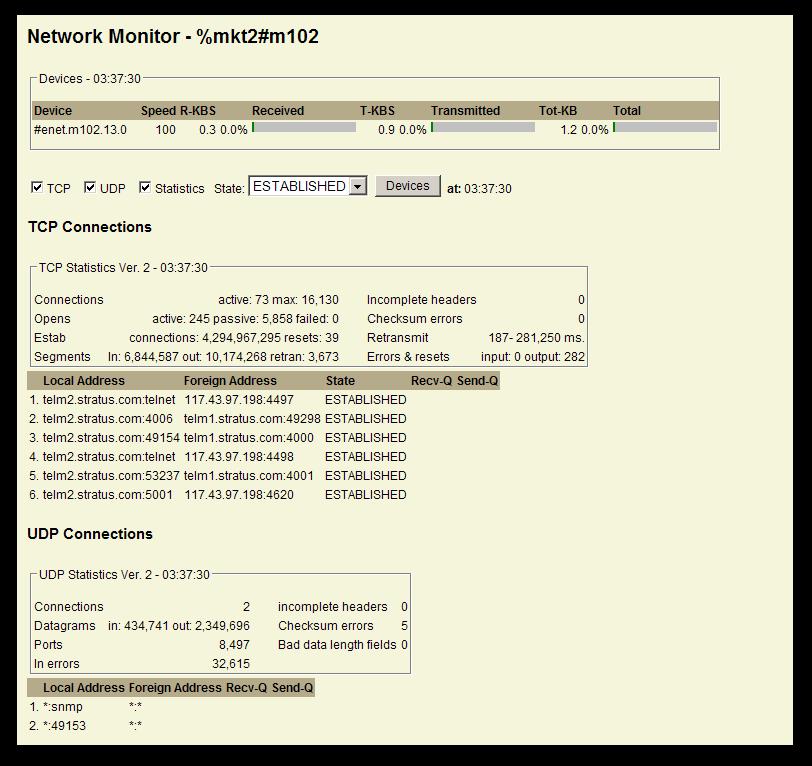 Network Monitor #1 |
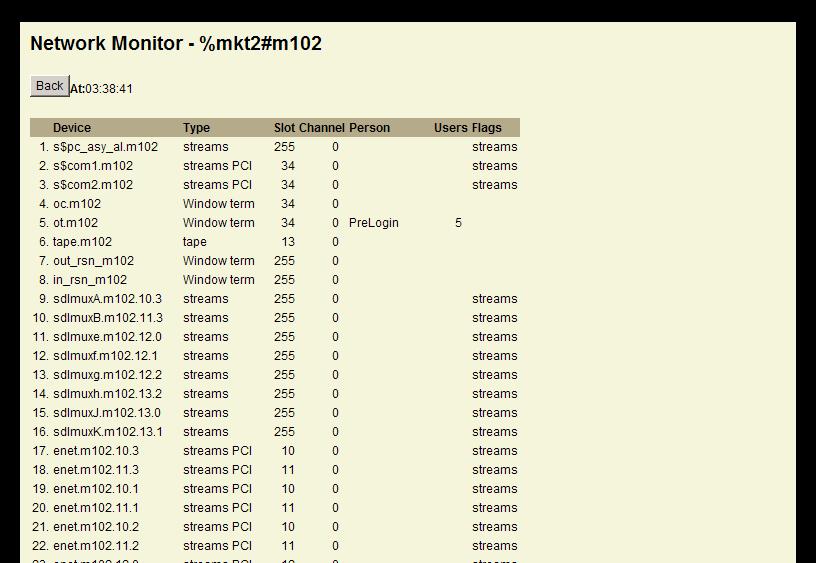 Network Monitor - Devices |
 |
 |
 |
 |
 |
| Alert Manager | FREE VOS Console | |
|---|---|---|
| Real-time basic system usage graphs of CPU, PF, I/O, Paging, Memory. | + | + |
| Real-time basic disk meters/graphs of disk utilization, %read-busy , %write-busy | + | + |
| Real-time basic Queue meters/graphs of Queue utilization, message processing rate (TPS) | + | + |
| Real-time list-users meters/graphs of resource consumption and overhead of processes and process-groups (CPU,I/O, memory) | + | + |
| Real-time VOS-BATCH monitor | + | + |
| Real-time NETSTAT monitor | + | + |
| Secure VOS-Explorer | + | + |
| Standard VOS user-id and password verification; additional auditing and security benefits | + | + |
| Restriction of users to the secure read-only Browser interface (no Telnet or FTP access) | + | + |
| Compliance with PCI secuirty requirements | + | - |
| Thresholds and alarms related to all meters - system, disks, processes, queues | + | - |
| Application error filtering | + | - |
| System security alarms | + | - |
| Focal point for all security related and system activities: registration-admin, access-control-manager, VOS-command-shells, disaster-recovery and scheduler | + | - |
| File creation, directory and file size alarms | + | - |
| Monitoring of key logs: syserr, hardware, security and any application error-logs | + | - |
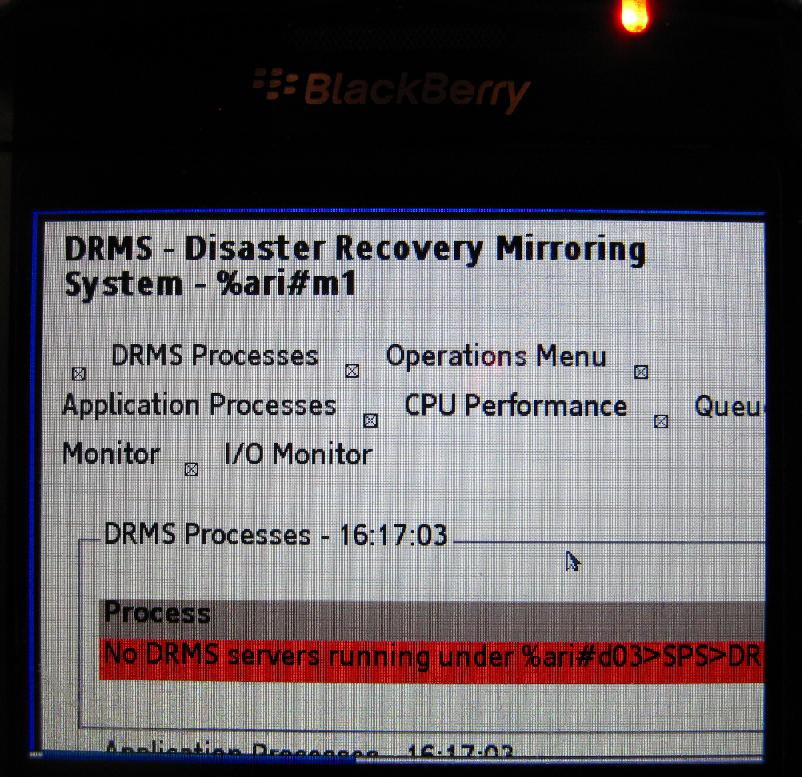
| Restarting of failed processes | + | - |
| Automated Email messages -- alarm notifications and report distribution | + | - |
| Automated command execution to correct errors or security violations | + | - |
| Detailed daily database | + | - |
| Operator's user's interface, including alarm-acknowledgment and alarm-escalation | + | - |
| Historical web-graphs of system performance over time (requires a license for the Performance software. | + | - |
| Alarms forwarding to enterprise monitoring facilities | + | - |
| Extensive reports | + | - |
![]()